Investigative
Does The Cost Of Energy Predict The Price Of Bitcoin?

This article examines one of the most frequently cited — and most frequently misunderstood — relationships in Bitcoin analysis: the connection between the cost of producing Bitcoin through mining and the price at which it trades on global markets. It draws on current data from 2025 and 2026, including post-halving mining economics, global hashrate movements, and energy price trends, to answer a deceptively simple question: does energy cost predict Bitcoin's price?
THE CLAIM EVERYONE REPEATS AND NOBODY HAS PROPERLY EXPLAINED
In October 2025, Bitcoin reached an all-time high of approximately $126,000. By June 2026, it was trading near $65,000 — below JPMorgan's estimated all-in production cost of $77,000–$78,000. The cost-floor argument is the most widely cited framework for understanding what this means: miners operate at a loss, shut down, supply contracts, price recovers. It is also, in its most common form, backwards.
The argument has an intuitive logic: if Bitcoin costs $X to produce, rational miners will not sell below $X indefinitely. If it trades below cost, mining becomes loss-making, miners exit, supply falls, and price recovers. This is commodity economics — the same mechanism that governs oil, gold, and copper production over time.
The argument also has a famous provenance. Satoshi Nakamoto wrote, in early correspondence, that "the price of any commodity tends to gravitate toward the production cost." Cited widely as endorsement of the cost-floor thesis, this line has given the model an almost canonical authority in Bitcoin circles.
Peer-reviewed academic research has tested this thesis rigorously and found it to be backwards. A 2022 study published in the Quarterly Review of Economics and Finance, examining the relationship between Bitcoin's mining costs and its price across the full historical record, found that changes in mining costs follow changes in Bitcoin's price rather than preceding them. This had been suspected by earlier econometric work, but the 2022 paper was notable for its explicit statement of what remained unexplained: it confirmed the direction of causality but offered no mechanism for why it runs that way.
That mechanism has not been clearly stated anywhere Alderlux is aware of. This article states it plainly, connects it to the specific mechanics of mining economics, and draws three conclusions about what the relationship between energy cost, mining rewards, and Bitcoin's price actually tells an allocator — and what it cannot tell them, no matter how carefully the data is measured.
THE MECHANISM: WHY COST FOLLOWS PRICE, AND WHY THIS WAS ALWAYS INEVITABLE
The reason mining cost follows Bitcoin's price — rather than leading it or setting a floor beneath it — is not an empirical accident. It is a structural feature of how the mining industry works, and it was inevitable from the moment Bitcoin's protocol was designed.
Bitcoin's protocol fixes two things: the number of coins produced per day (currently 450 Bitcoin, fixed regardless of how much energy is spent mining them), and the rate at which new mining difficulty adjusts to maintain the ten-minute block target. Everything else — the amount of computing power pointed at the network, the energy consumed, and therefore the cost of producing each coin — is determined by the market's behaviour, not the protocol's rules.
The Circular Argument Hidden Inside The Cost Floor Theory
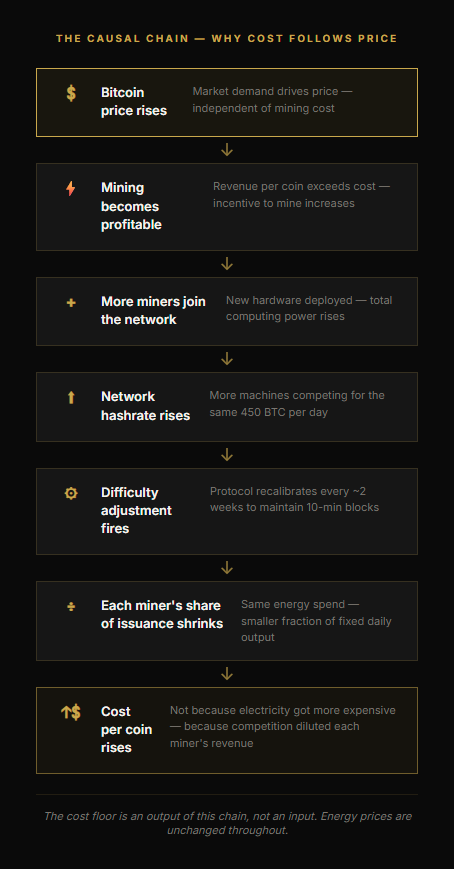
Here is the mechanism, stated with as much precision as possible. When Bitcoin's price rises, mining becomes more profitable. More profitable mining attracts more miners and more hardware onto the network, which increases total hashrate. Bitcoin's difficulty adjustment — recalibrating approximately every two weeks — responds by raising the computational work required to mine each block. The critical point is what this does to individual miner economics: the operator's electricity costs are unchanged, but the protocol has just reduced their proportional claim on a fixed daily issuance of 450 Bitcoin. More hashrate competing for the same coin output means each miner earns a smaller share of the fixed daily reward. The cost per coin rises not because the price of electricity has increased, but because the difficulty adjustment has diluted the revenue that each unit of energy produces. The production cost is consequently a function of competitive pressure, which is itself a function of price — making it a lagging consequence of market conditions rather than an independent input to them.
The practical implication is precise: miners are price takers, not price setters. They receive whatever the market determines and adjust their economics accordingly. This is not a peripheral observation — it is the reason the cost-floor model fails. A price floor requires the ability to influence price. Miners have none.
This means the cost-floor argument contains a circular dependency it cannot resolve. If Bitcoin's price were to fall to its current production cost and stay there, the cost of production would not remain at that level — it would fall too, as less efficient miners exit, difficulty adjusts downward, and the energy required per coin decreases. The floor chases price downward as reliably as it chases it upward.

Satoshi's observation that commodities gravitate toward production cost describes a long-run equilibrium. It does not describe a floor. Gold has traded both far above its production cost (during speculative peaks) and, in some regional markets, at or near it. What Satoshi described is a mean-reversion tendency over very long time horizons — not a technical support level that holds in any individual cycle. The misreading of this line has been surprisingly durable.
The Specific Shape Of The 2026 Evidence
The current environment provides unusually clear evidence — but reading it carefully reveals a more complicated picture than the aggregate numbers suggest. Bitcoin has traded below JPMorgan's estimated all-in production cost of approximately $77,000–$78,000 for an extended period in 2026, following the October 2025 all-time high of approximately $126,000. The cost-floor theory predicts this situation should be brief — miners exit, difficulty falls, supply tightens, price recovers. In broad terms this sequence is occurring, but the selling behaviour driving it is not uniform. It reflects at least three distinct motivations, and only one of them directly supports the debt-structure inversion argument.
The clearest case for debt-driven forced selling is MARA. In July 2024, MARA adopted a formal comprehensive HODL policy, publicly committing to retain all mined Bitcoin. By Q3 2025 it had begun softening that stance. In its 10-K filed March 2026, MARA authorised the sale of all 53,822 BTC on its balance sheet — a reversal driven in part by pressure on its $350 million Bitcoin-collateralised credit line, where the loan-to-value ratio had climbed to approximately 87% as Bitcoin fell to $68,000. MARA subsequently sold 15,133 BTC in March 2026 alone, generating approximately $1.1 billion in proceeds. This is forced selling in the precise sense the argument requires: a miner that had chosen to hold was compelled to liquidate by debt structure, not by market conviction. The scale of leverage across parts of the sector reinforces this — WULF carries $5.7 billion in total debt and CIFR issued $1.7 billion in senior secured notes, with interest costs now a meaningful per-coin drag on profitability for several operators.
But the picture is not uniform, and the MARA case should not be generalised too freely. IREN — one of the sector's largest miners by hashrate — holds zero Bitcoin, and this is not a recent distress signal. It reflects a consistent operating philosophy maintained since the company's inception: mine, sell immediately, redeploy cash into infrastructure. IREN has never accumulated a Bitcoin treasury, and its zero holding carries no information about financial stress. The same is broadly true of TeraWulf, which holds just 15 BTC. For these operators, selling every coin produced is routine policy rather than capitulation — which means their contribution to Q1's record 32,000 BTC sell-off is materially different from MARA's, even though it appears identical in the aggregate data.
A third category complicates the picture further: operators selling specifically to fund an AI infrastructure pivot. Core Scientific liquidated approximately 1,900 BTC in January 2026 for $175 million. Bitdeer reduced its holdings to zero to fund data centre expansion. Bitfarms, with its CEO explicitly stating "we are no longer a Bitcoin company," has reduced holdings from a peak of 3,301 BTC to 1,827 BTC. These sales are not driven by below-cost mining conditions — they would likely be occurring regardless of where Bitcoin's price sat relative to production cost, because the capital is being deployed into a different business entirely.
The aggregate Q1 2026 sell-off of 32,000 BTC — a quarterly record by volume, exceeding the Terra-Luna collapse sell-off of 2022 — confirms the core argument: below-cost conditions do not automatically produce supply contraction among public miners. This selling occurred while the median operator was losing approximately $10,000–$12,000 per coin mined. The supply pressure is real regardless of which operator is selling or why. What the motivation does determine is when the selling stops. Debt-driven liquidation ends when obligations are met or the operator fails. AI-pivot selling ends when the reallocation is complete. Routine operational selling never stops — it is structural and permanent. Treating the aggregate figure as a single wave of distress-driven supply will consistently mistime the recovery.
DIMINISHING RETURNS: WHAT HAPPENS WHEN THE HALVING STOPS MATTERING
The halving is the mechanism that fundamentally determines mining economics — and with it the heart of the energy-cost-to-price relationship. Every four years, it resets how much energy must be expended to produce each new coin. Understanding how its influence is changing is not a detour from the question this article set out to answer; it is the answer, stated from a different angle.
Four halvings have now occurred — in 2012, 2016, 2020, and 2024. Each one reduced the block reward by 50%. And each successive halving has produced meaningfully smaller post-halving price gains: from thousands of percent in 2012, to hundreds of percent in 2016 and 2020, to approximately 100% in the 2024 cycle (measured from the April 2024 halving date to the October 2025 all-time high).
This diminishing-returns pattern is widely observed but rarely explained with precision. The energy-cost-to-price framework suggests one mechanism — that each halving reduces miner sell pressure by cutting daily issuance, and this supply reduction drives price appreciation. If that were the primary mechanism, the gains should be consistent rather than declining, because the relative supply reduction at each halving is exactly the same: 50%. But the gains are not consistent. They are declining systematically.
The Reason Is Not What Most People Think
The standard explanation is that Bitcoin's market has "matured" and is therefore less volatile, producing smaller cycles. This is true, but it is not the full mechanism. The more precise explanation connects directly to the energy-cost relationship.
At each successive halving, the absolute daily supply reduction — the number of Bitcoin that stops being created — becomes smaller. The 2012 halving removed approximately 3,600 Bitcoin per day from new issuance. The 2020 halving removed 900 Bitcoin per day. The 2024 halving removed 450 Bitcoin per day. As of 2026, those 450 Bitcoin represent less than 0.05% of the total circulating supply. Daily ETF inflows and outflows regularly exceed daily new issuance by a factor of ten or more.
This represents a fundamental shift in the relationship between mining economics and Bitcoin's price. In early cycles, miners were a dominant force in price formation — their sell pressure represented a meaningful fraction of daily trading volume, and what they chose to do with their production moved markets. That is no longer true. Daily new issuance is now too small relative to circulating supply and institutional flow volumes to drive price direction, and what miners do with their production — whether they hold or sell, whether they are stressed or well-capitalised — registers primarily as a sentiment and stress indicator rather than a determinant of price. Institutional ETF flows, macro liquidity conditions, and corporate treasury decisions now carry far greater weight than the entire mining industry's collective output.
The halving's price impact is diminishing not because Bitcoin has "matured" in some abstract sense, but because daily new issuance has become too small relative to existing supply and the institutional flows that now dominate daily trading to drive price formation. This shift is permanent — each successive halving will have less direct price impact than the last. The 2028 halving will remove approximately 225 Bitcoin per day from issuance. At that scale, its direct supply impact on price is negligible, whatever its symbolic significance.
What this means for market structure is consequential: Bitcoin has transitioned from a miner-driven market into a capital-driven market. In the early cycles, miners were the dominant source of both new supply and sell pressure — their behaviour moved price. Today, the decisions of institutional allocators, ETF flows, and corporate treasury programmes carry far greater weight than anything the mining industry collectively does. The halving matters less each cycle not because the event is less significant, but because the market it acts upon has grown beyond its reach.
WHAT THE ENERGY RELATIONSHIP ACTUALLY TELLS YOU — AND WHAT IT CANNOT
If energy cost does not predict Bitcoin's price, and the halving's direct price impact is in irreversible decline, does the entire framework of mining economics become irrelevant to an allocator? No — but the useful signals are different from the ones most commonly cited.
What Mining Data Actually Measures
Hashprice — the revenue per unit of hashrate per day — is a real-time, compressed indicator of miner profitability. It does not predict where Bitcoin's price is going. What it measures with precision is where the mining industry currently sits relative to its own cost structure, and whether the conditions for a capitulation event are developing. That is a different and more modest claim — but it is a genuinely useful one, because capitulation events have a documented historical relationship with the exhaustion of forced selling, which has in turn preceded price recovery in every major cycle since 2019.
In 2026, the beta of mining difficulty to Bitcoin's price has risen to approximately 0.62 — meaning that for every 1% move in Bitcoin's price, network difficulty tends to follow with a move of roughly 0.62% in the same direction. This makes the network currently more reactive to price moves than at any point in the post-halving period. For an allocator, this cuts both ways: a further price decline triggers faster miner exits and quicker exhaustion of forced selling; a price recovery restores mining economics more rapidly than prior cycles would suggest. This is a consequence of where the industry currently sits: the 2024 halving cut the block reward from 6.25 to 3.125 BTC, halving the revenue each block produces without changing the cost of producing it — which means the cost per coin, measured in dollar terms, effectively doubled at a stroke for any operator whose hashrate and electricity costs remained constant. When more of the network is clustered near the margin, even modest price moves are enough to push machines into loss-making territory and trigger hashrate withdrawals — producing sharper and faster difficulty responses than in prior cycles when margins were wider. The rising beta means the difficulty data is currently more signal-rich than at any point in the post-halving period.
The critical qualifier is timing. Miner capitulation events — measurable by on-chain sell pressure, hashrate decline, and downward difficulty adjustments — have historically been followed by price recovery, but the lag between the capitulation signal and the price bottom has varied significantly across cycles. The signal identifies a condition, not a date. In 2019, recovery followed within two months. Following the 2021 China mining ban, it took approximately six months. In 2022, roughly three months elapsed between the Hash Ribbon signal and the eventual bottom. The range is too wide to use as a timing tool in isolation.
What It Cannot Tell You: Where Price Is Going
The energy-cost relationship cannot tell you Bitcoin's price direction for the same reason it has never reliably done so: price is determined by demand, not supply cost. Since 2024, the dominant demand drivers have been institutional ETF flows, corporate treasury decisions, and macro liquidity conditions — none of which are connected to energy prices or mining economics in any direct way.
One specific failure mode is worth naming precisely. The production cost is sometimes cited as a "generational accumulation opportunity" signal — the argument being that whenever Bitcoin trades below its production cost, a buying opportunity is present. The historical data shows this has coincided with eventual recovery in every prior instance, which gives the argument a superficial plausibility. But it conflates two different things: where miner stress begins, and where price bottoms. There is a gap between those two points, and in that gap you can lose a significant amount of capital.
The 2022 cycle illustrates this precisely. Bitcoin's all-in production cost at the time was estimated at approximately $17,000–$20,000 per coin — and Bitcoin did indeed trade down to that level, triggering the cost-floor signal for those watching it. But it did not stop there. It continued falling to approximately $15,500 — piercing the lower bound of the production cost range and staying below it for several weeks before recovering.
In 2026 the same logic applies at a higher absolute level. The 2024 halving cut the block reward from 6.25 to 3.125 BTC — halving the revenue each block produces without altering the cost of producing it, which means the cost per coin effectively doubled for any operator whose hashrate and electricity costs remained constant. Production costs now range from $77,000 to over $92,000 depending on the operator. Bitcoin is currently trading below this range. The cost-floor signal is therefore active by the same logic that would have told you to buy in mid-2022. What that signal cannot tell you is whether Bitcoin is at $65,000 on its way to $80,000 or on its way to $50,000. In 2022 the equivalent signal fired at $20,000 and price fell another 25% before bottoming. A comparable move from current levels would imply prices well below $50,000. The production cost figure does not bound the depth of further possible decline — it identifies a level at which miner stress begins, nothing more.
The Alderlux Position
Alderlux tracks hashprice, difficulty adjustments, and on-chain miner flow data as part of the cycle-position framework published in The Insider. These are useful stress indicators and contribute to cycle-position assessment. They are not standalone price predictors, and Alderlux treats any analysis that presents them as such with the same scepticism it applies to any other single-variable Bitcoin pricing model.
THE U-SHAPED SELLING CURVE — AND THE INDICATOR BUILT TO TRACK IT
Everything discussed so far points toward a question that investment bank research rarely answers precisely: at any given level of mining profitability, how much of their production do miners actually sell? The answer is not what intuition suggests — and understanding the actual shape of miner selling behaviour changes how you read the market at every stage of the cycle.
The intuitive answer is that miners sell more when they are more profitable, and less when they are not. The data shows the opposite at both extremes. Selling is highest when margins are worst. Selling is lowest when margins are moderate. And selling rises again when margins are exceptional. The curve is U-shaped, not linear — and each arm of the U is driven by an entirely different mechanism.
The Left Arm: Forced Selling At The Bottom
At the bottom of the profitability range — when hashprice falls to or below the cost of production — miners do not reduce selling. They increase it. Debt-laden operators must mine and sell continuously to service obligations regardless of price, as documented in Section II with the Q1 2026 data. Miners with thin margins cannot hold production in hope of recovery — they need cash now. The result is that below-cost conditions generate maximum selling pressure, not minimum. In Q1 2026, public miners sold a record 32,000 Bitcoin while operating at a loss. The left arm of the U is steep.
The Trough: Minimum Selling In The Middle Zone
As profitability rises from that floor toward a moderate, sustainable level, selling pressure falls. Miners whose margins have recovered have the flexibility to hold a portion of their production. They are no longer forced sellers. Some accumulate. The on-chain Miner Supply Spent ratio — which measures how much of earned Bitcoin is being sold versus held — dropped significantly in the moderate-profit phase of 2025 compared to the prior stress period. This zone is paradoxically the period of least miner-driven sell pressure, and therefore the most supportive of price. The trough of the U corresponds broadly to hashprice between $35 and $55 per PH/s/day at current network conditions.
The Right Arm: Profit-Taking At The Top
At the top of the profitability range — when hashprice rises well above breakeven and miner revenue reaches historically elevated levels — selling increases again. Not from distress, but from rational profit-taking. Miners earning significantly above their cost of production have every incentive to realise some of that margin in fiat. The Miner Position Index rising above 2.0 has historically been described as sophisticated money — operators with the best visibility into their own economics — taking profits ahead of market peaks. The right arm of the U is where cycle tops have historically been confirmed by miner behaviour, not predicted by price charts alone.

The Alderlux Hashprice Stress Indicator
To track where the mining industry sits on this curve at any given moment, Alderlux built a proprietary TradingView indicator: the Hashprice Stress Indicator (ALX·HSI). It was designed specifically to make the U-shaped relationship visible in real time, combining hashprice calculation, profitability zone classification, the Hash Ribbon capitulation signal, and a normalised stress reading into a single, continuously updated instrument.
The indicator calculates hashprice from on-chain data using network hashrate (sourced from Glassnode, with a native TradingView feed as fallback) and network difficulty. The core formula produces a revenue-per-petahash-per-day figure, which is then compared against the Cost of Hash Threshold — set at $35/PH/s/day for Q2 2026 and updated quarterly from CoinShares and Hashrate Index mining cost reports. The resulting HSI percentage shows precisely how far above or below breakeven the median operator sits at any given moment.
Alongside the profitability reading, the indicator overlays the Hash Ribbon — a capitulation and recovery signal comparing the 30-day and 60-day moving averages of network hashrate. When the 30-day crosses below the 60-day, miners are collectively shutting down. When it crosses back above, the weakest operators have exited and forced selling pressure from distressed miners is exhausting itself. This crossover has historically preceded price recovery across every major capitulation since 2019, with lags ranging from two to six months.

At current readings, the indicator places the mining industry in the AT BREAKEVEN zone — the left arm of the U-curve. Hashprice sits approximately 11% below the median operator's cost of production. The Hash Ribbon remains in capitulation. The U-shaped framework places this squarely in the zone of elevated forced selling, where the weakest operators are exiting and the Hash Ribbon recovery signal — the moment at which forced selling exhausts itself — has not yet fired.
ALX·HSI In The Insider
The Hashprice Stress Indicator reading is published in each monthly and quarterly edition of The Insider alongside Alderlux's full cycle-position assessment. Zone threshold settings are reviewed and updated quarterly in line with CoinShares and Hashrate Index mining cost estimates.
THE NEXT HALVING AND THE QUESTION NOBODY IS ASKING
The next Bitcoin halving is expected in April 2028, at which point the block reward will fall from 3.125 to 1.5625 Bitcoin. At that point, over 98% of all Bitcoin will have been mined. Daily new issuance will be approximately 225 coins — worth roughly $14 million at current prices, against daily ETF flow volumes that regularly exceed $500 million to $1 billion. The new supply entering the market each day will be too small to move it.
Most analysis of the 2028 halving focuses on the same question that drove analysis of the previous four: how will it affect price? The direct supply mechanism is increasingly the wrong frame for this question. At $250,000 per coin — a level within the range of serious long-term forecasts — the 225 BTC produced daily after the 2028 halving would represent approximately $56 million of new daily supply. Single-day inflows to BlackRock's IBIT ETF alone have exceeded $1 billion. The supply reduction from the halving is a rounding error relative to the institutional flow volumes that now dominate price formation, and that disparity widens at higher prices rather than narrowing. What the 2028 halving will not do is mechanically drive price through supply contraction in the way the 2012 or 2016 halvings did.
What it may still do is drive price through narrative. The halving is a fixed calendar event with significant symbolic weight, widely anticipated and historically associated with bull cycles. Market participants front-run it, media covers it, and sentiment responds to it regardless of whether the supply mathematics justify the reaction. That narrative effect is real and should not be dismissed — but it is a different mechanism entirely from supply-driven price formation, and conflating the two has been the source of most halving-cycle analysis errors in recent years. The 2028 halving may be remembered as the first halving where psychology matters more than mathematics.
The question that matters more, and that very few analysts are focusing on, is this: what happens to network security when the block subsidy approaches zero?
The Long-Run Question Worth Watching
Bitcoin's network security is paid for by miners. Miners are paid in block rewards and transaction fees. The block reward currently stands at 3.125 BTC per block following the April 2024 halving, and will fall to approximately 1.5625 BTC at the next halving in 2028, roughly 0.78 BTC in 2032, 0.39 BTC in 2036, and so on — halving approximately every four years until the reward becomes negligible somewhere around 2140. Over that same period, transaction fees will need to grow as a share of total miner revenue if the current level of network security is to be maintained. Currently, fees represent approximately 10–15% of total miner revenue. That ratio will need to shift materially over the coming decades — not urgently, but directionally and inevitably.
There is, however, a natural counterweight built into the same mechanism — and it is the foundation of Bitcoin's long-run economic design. Each halving reduces the coin reward, but if adoption continues and demand for a fixed-supply asset grows, the price of each coin rises to compensate. The seesaw effect is the intended architecture: fewer coins earned per block, but each coin worth more in dollar terms. A miner earning 0.39 BTC per block in 2036 may be earning more in real revenue than a miner earning 3.125 BTC today, if Bitcoin's price by that point reflects two further halving cycles and continued institutional adoption. The protocol was designed with this dynamic explicitly in mind — Satoshi's original writing described the subsidy as a bootstrapping mechanism, intended to be replaced over time by transaction fees as the network matured and coin value increased.
Whether that seesaw balances cleanly at each step is not guaranteed, and this is where the genuine uncertainty sits. The transitions between halvings have historically been volatile — there is typically a period of miner stress immediately after each halving before price catches up, which is precisely the Q1 2026 environment described elsewhere in this article. The long-run question is whether each successive price level is sufficient to sustain mining economics through the next reduction, and whether fee revenue grows alongside it. Fee revenue increases when more transactions compete for the fixed space available in each block — users bid higher fees to get confirmed faster, just as any scarce resource is priced by demand. As Bitcoin's price rises, users also pay more in absolute dollar terms for the same percentage fee. But this requires active on-chain use, which sits in mild tension with the dominant store-of-value thesis under which most holders buy and hold Bitcoin rather than transact with it. Over a horizon stretching to 2036 and beyond, both depend on adoption trajectories that remain genuinely open. This is a question worth holding as context rather than as concern — and one that serious allocators with decade-long horizons are right to monitor through successive halvings.
For a full explanation of how the halving schedule, block rewards, and proof-of-work mechanism underpin Bitcoin's security model, see Understanding Blockchain: Ownership, Scarcity And The Future Of Finance.
WHAT THIS ARTICLE CONCLUDES
The conclusion is straightforward: energy cost does not predict Bitcoin's price. Price moves first, and mining cost adjusts to follow it through the difficulty adjustment mechanism. When miners are under financial stress, the debt structure of the modern mining industry means they sell more Bitcoin, not less — the opposite of what the cost-floor model predicts. And the record Q1 2026 sell-off, examined carefully, reflects three distinct motivations — forced debt liquidation, AI pivot reallocation, and routine operational policy — that the aggregate figure cannot distinguish between. Each requires a different interpretation.
Energy cost data is useful, correctly positioned. It is a real-time indicator of miner stress, a contextual input for understanding where the industry sits in a cycle, and one component of a properly constructed analytical framework. What it is not is a price predictor. The Alderlux Hashprice Stress Indicator, available on TradingView for members, tracks hashprice against the median operator's cost of production in real time — displaying exactly where the mining industry sits on the profitability curve at any given moment, including the current AT BREAKEVEN reading with the Hash Ribbon in capitulation. That is the appropriate use of mining cost data: as a stress gauge, read alongside price, sentiment, and macro conditions, rather than as a standalone signal for where price will go next.
The Cost Floor Is A Mirror,
Not A Foundation
The View From The Edge
In 2022, Bitcoin's price fell through its production cost and kept falling to $15,500. The floor did not hold. In 2026, the same conditions are present at a higher price level. The cost floor is not a guarantee — it is a marker of where miner stress begins. Between that marker and a price bottom, further material decline is possible. That gap is where allocators who mistake a stress indicator for a price signal get hurt.
The conclusion this article reaches is not that mining data is useless. It is that most people are using it for the wrong purpose. The production cost figure is not a price floor — but miner capitulation signals, hashprice compression, and on-chain sell pressure do have a documented track record of marking the point at which forced selling exhausts itself — which has historically preceded recovery. That is a meaningful signal. It tells you where the supply pressure is coming from and when it may be running out. What it cannot tell you is how far price falls before that point, or how long recovery takes. The difference between those two things — a signal about supply exhaustion versus a prediction of price direction — is where most of the analytical errors in this space are made.
Alderlux approaches Bitcoin through the lens of ownership, capital allocation, and market structure — the three questions that determine what Bitcoin is, who holds it, and what it is worth. Seen through that lens, this article's conclusion is straightforward: the cost of production tells you about the second of those questions, not the third. It tells you what miners must earn to remain viable. It says nothing about what investors are willing to pay.
Investors determine Bitcoin's value.
Miners adapt to that valuation.
Alderlux provides education, research and succession planning services in relation to Bitcoin and digital assets. We do not provide regulated financial advice, investment recommendations, legal or tax advice. Alderlux is not authorised by the Financial Conduct Authority and does not provide cryptoasset custody, dealing or arranging services. Bitcoin, cryptocurrencies and digital assets are speculative and volatile assets. Prices may rise or fall significantly within short periods of time. Investors may experience substantial losses, including the loss of their entire investment. Past performance is not indicative of future results.